
Product Categories
The Product Categories view of the Back Office displays sales statistics during the selected time period, broken down by product category. You can also use additional criteria such as Company, Store. Cost Unit, Workstation and User to filter the data.
Product Categories
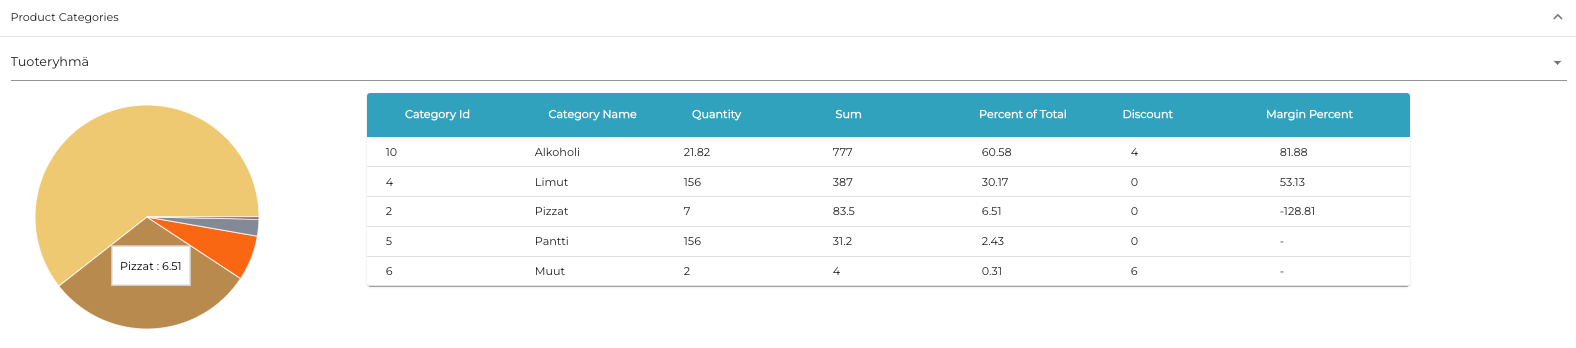
The data is shown in both pie chart (hover the mouse cursor over the chart to see details) and table formats. The following information is displayed:
Category Id
Category Name
Quantity of products sold
Sum
Percent of total
Discount (number of discounts given)
Margin percent